
Resource Analytics
| Report Group | Report Name | Report Description |
|---|---|---|
| Cloud Service Analytics | EC2 Analytics | This report provides in depth analytics on your AWS EC2 resources including orphaned resources, under-utilized, over-utilized, stopped / started state, etc. |
| Cloud Service Analytics | ECS Analytics | This report provides AWS details of resource category Fargate. |
| Cloud Service Analytics | Workspace Analytics | This report provides workspace details of resources and the workspace cost. |
| Cloud Service Analytics | Azure VM Analytics | This report provides details about VMs like virtual machine cost trend, virtual machines size by cost, virtual machines by cost, utilization, etc. |
| Cloud Service Analytics | GCP VM Analytics | This report provides VM details for various GCP resources with cost and utilization. |
| Cloud Service Analytics | OCI Compute Analytics | This report provides compute analytics details of resources for OCI cloud accounts. |
| Inventory Analytics | AWS Inventory by Tags | This report provides resources and their tag details from AWS inventory. |
| Inventory Analytics | Azure Inventory by Tags | This report provides resources and their tag details from Azure inventory. |
| Inventory Analytics | GCP Inventory by Label | This report provides resources and their label details from GCP inventory. |
| Inventory Analytics | All Resource Inventory | This report provides a full inventory report across all resource types. |
| Inventory Analytics | Asset 360 | The Asset 360 Report is a perspective report based on inventory. This report provides details about costs, security threats or vulnerabilities for particular resources, guardrail recommendations to be optimized, etc. |
| Inventory Analytics | CloudOps Report | A CloudOps Report provides customers with insight into their cloud infrastructure's performance. This report helps in optimizing cloud operations, reducing costs, and identifying potential risks and vulnerabilities. |
| Inventory Reports | All Resource Inventory Details Report | This report provides information about various inventories and is a multi-cloud report. |
| Inventory Reports | Cloud Service Resources | This report provides resource details for different cloud providers. |
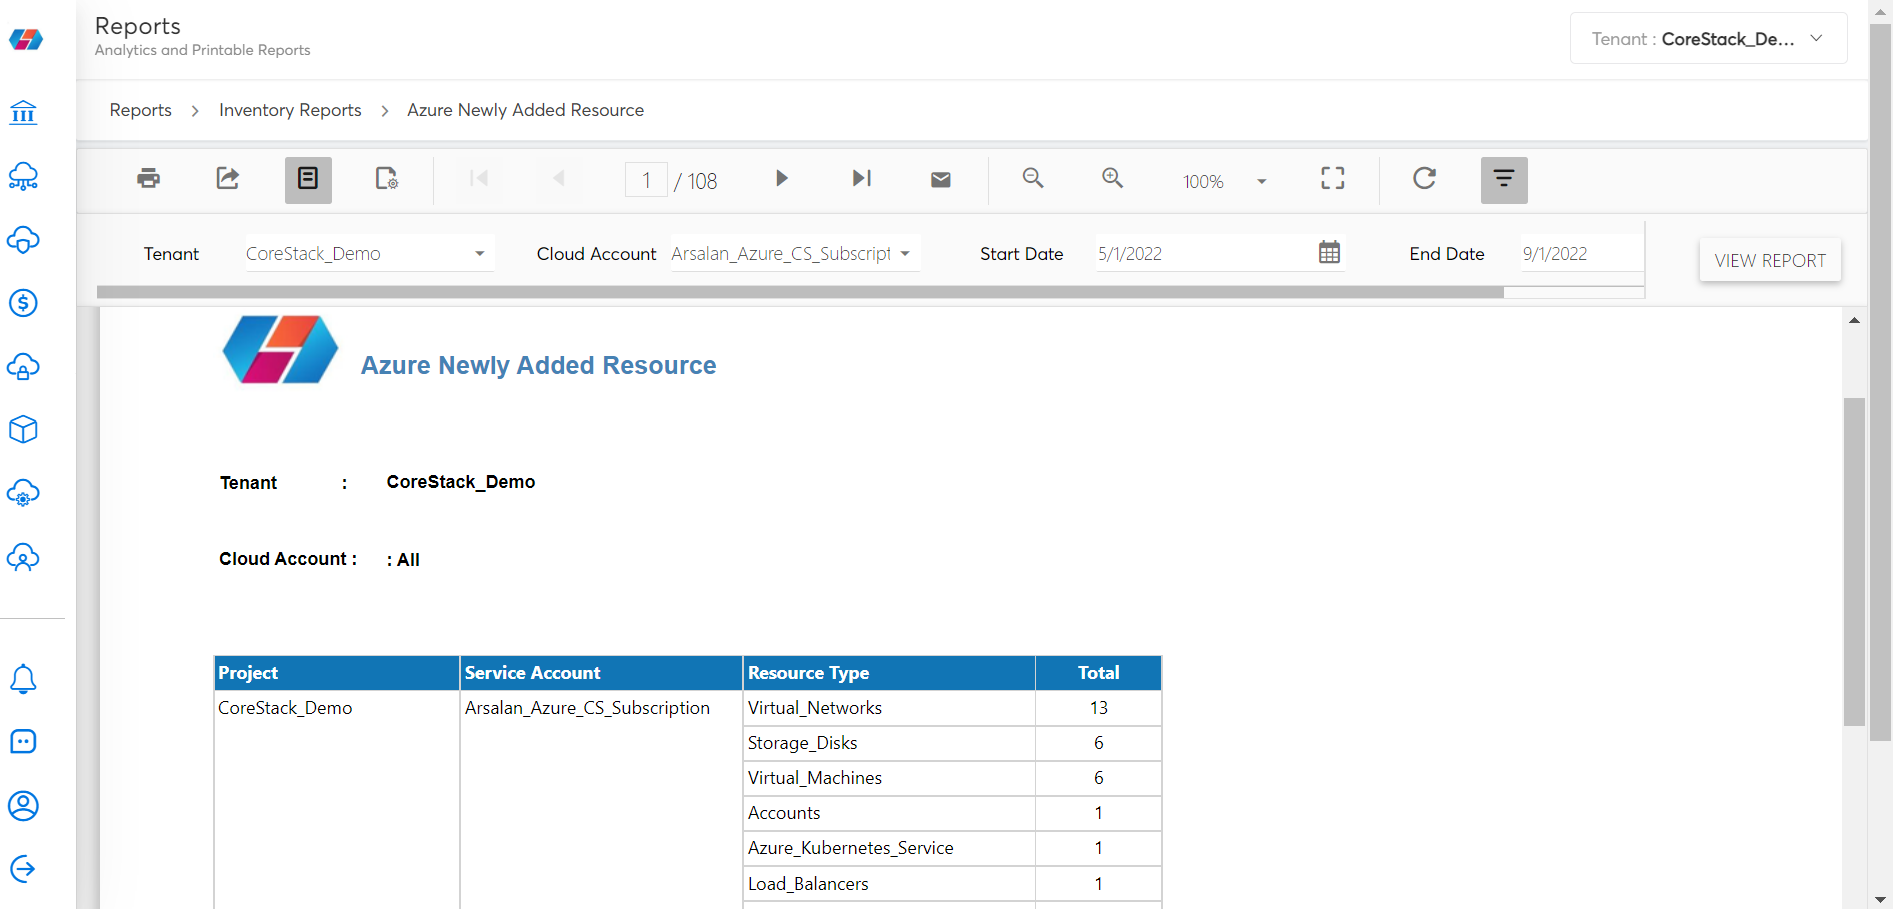
| Inventory Reports | Azure Newly Added Resource | This report provides details about newly added resources for Azure cloud accounts. |
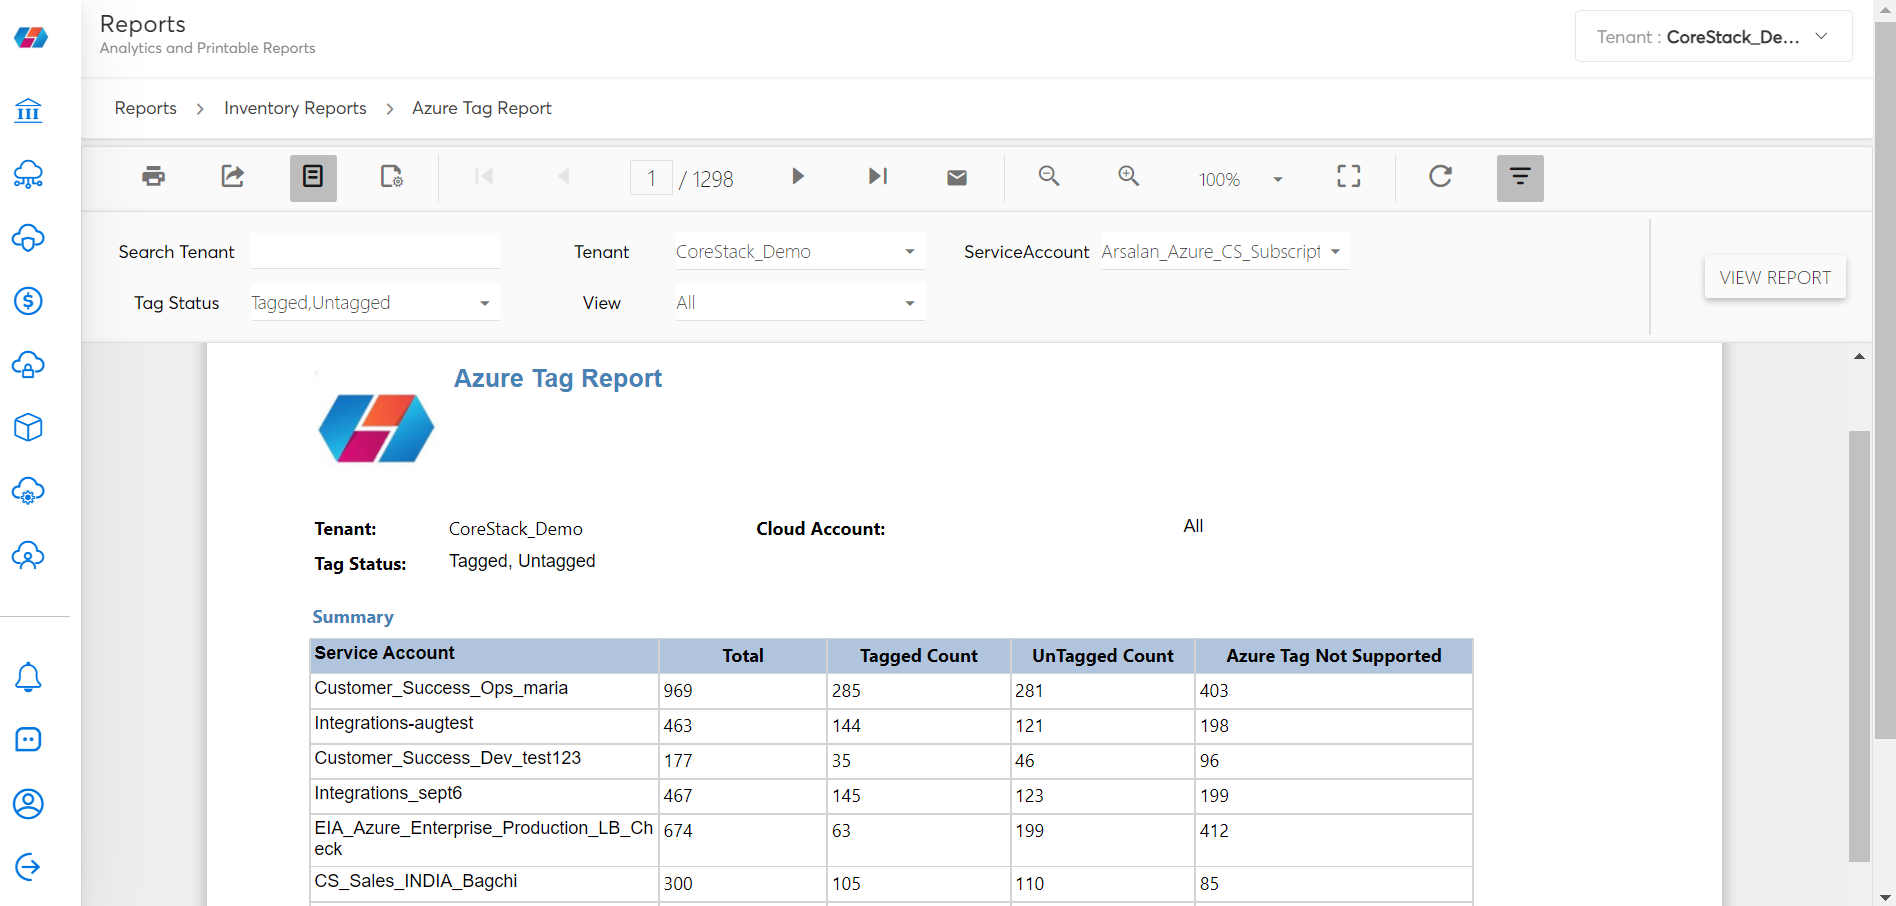
| Inventory Reports | Azure Tag Report | This report provides tagging details for Azure cloud accounts. |
Inventory Reports
Azure Newly Added Resource
You can use SQL Server Reporting Services (SSRS) report for scheduling.
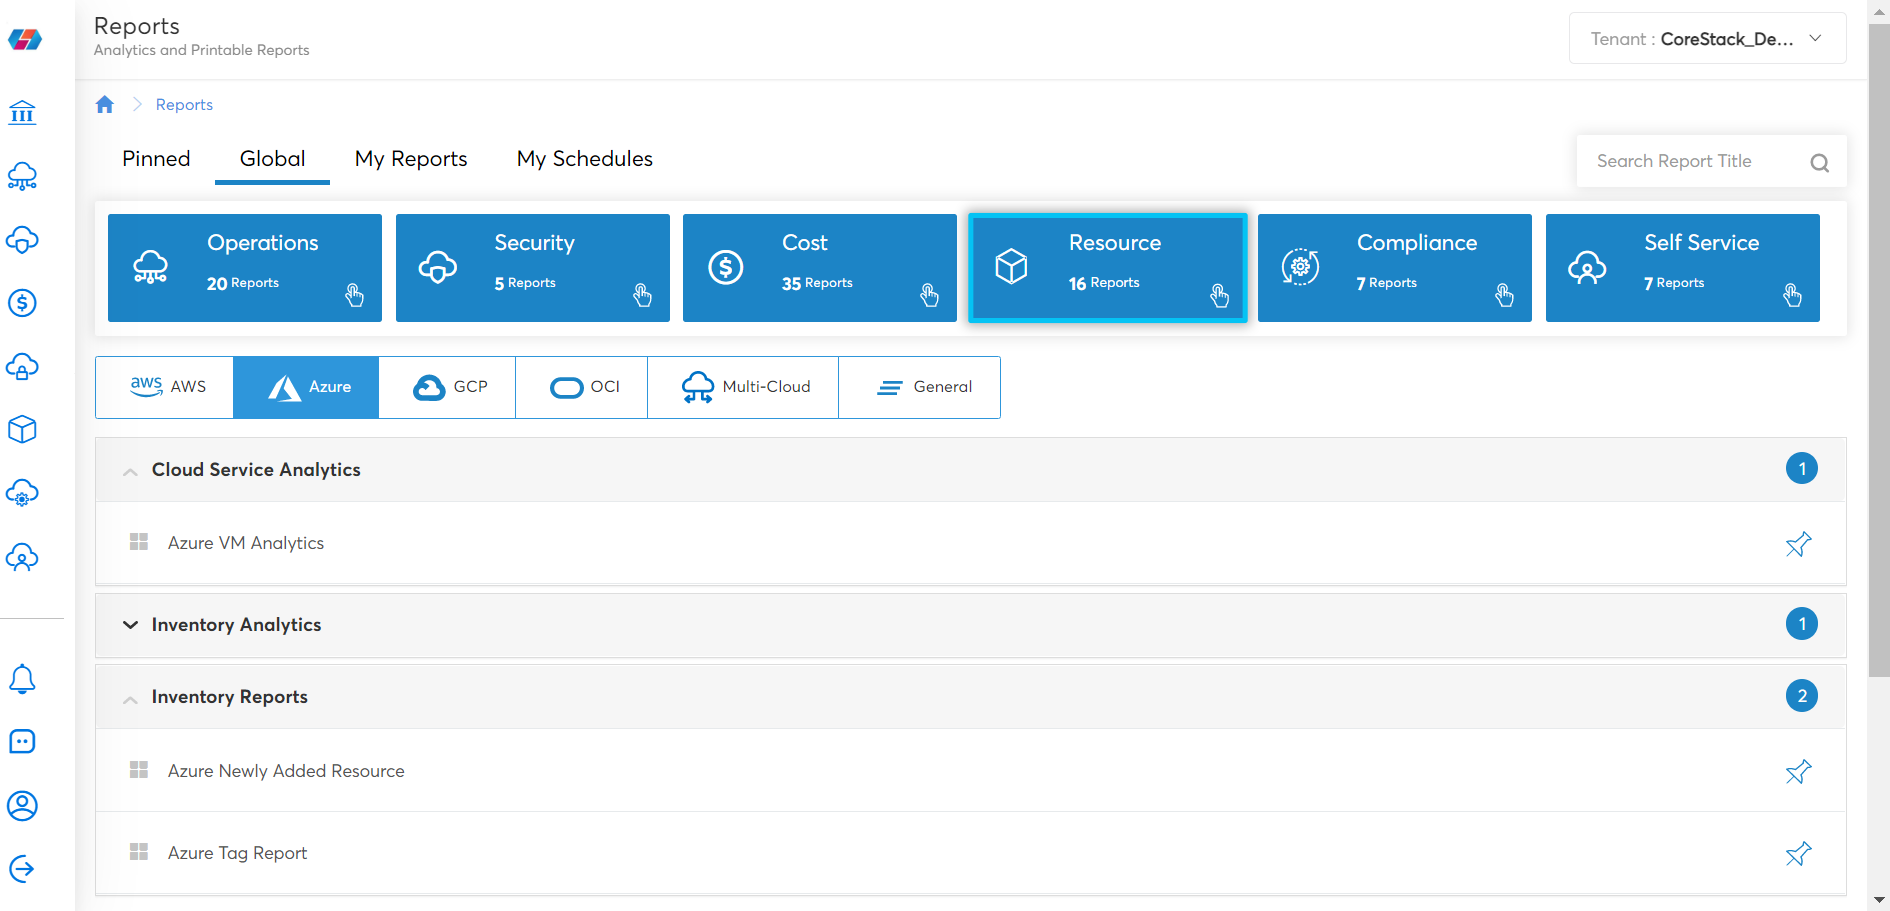
- Click Reports.
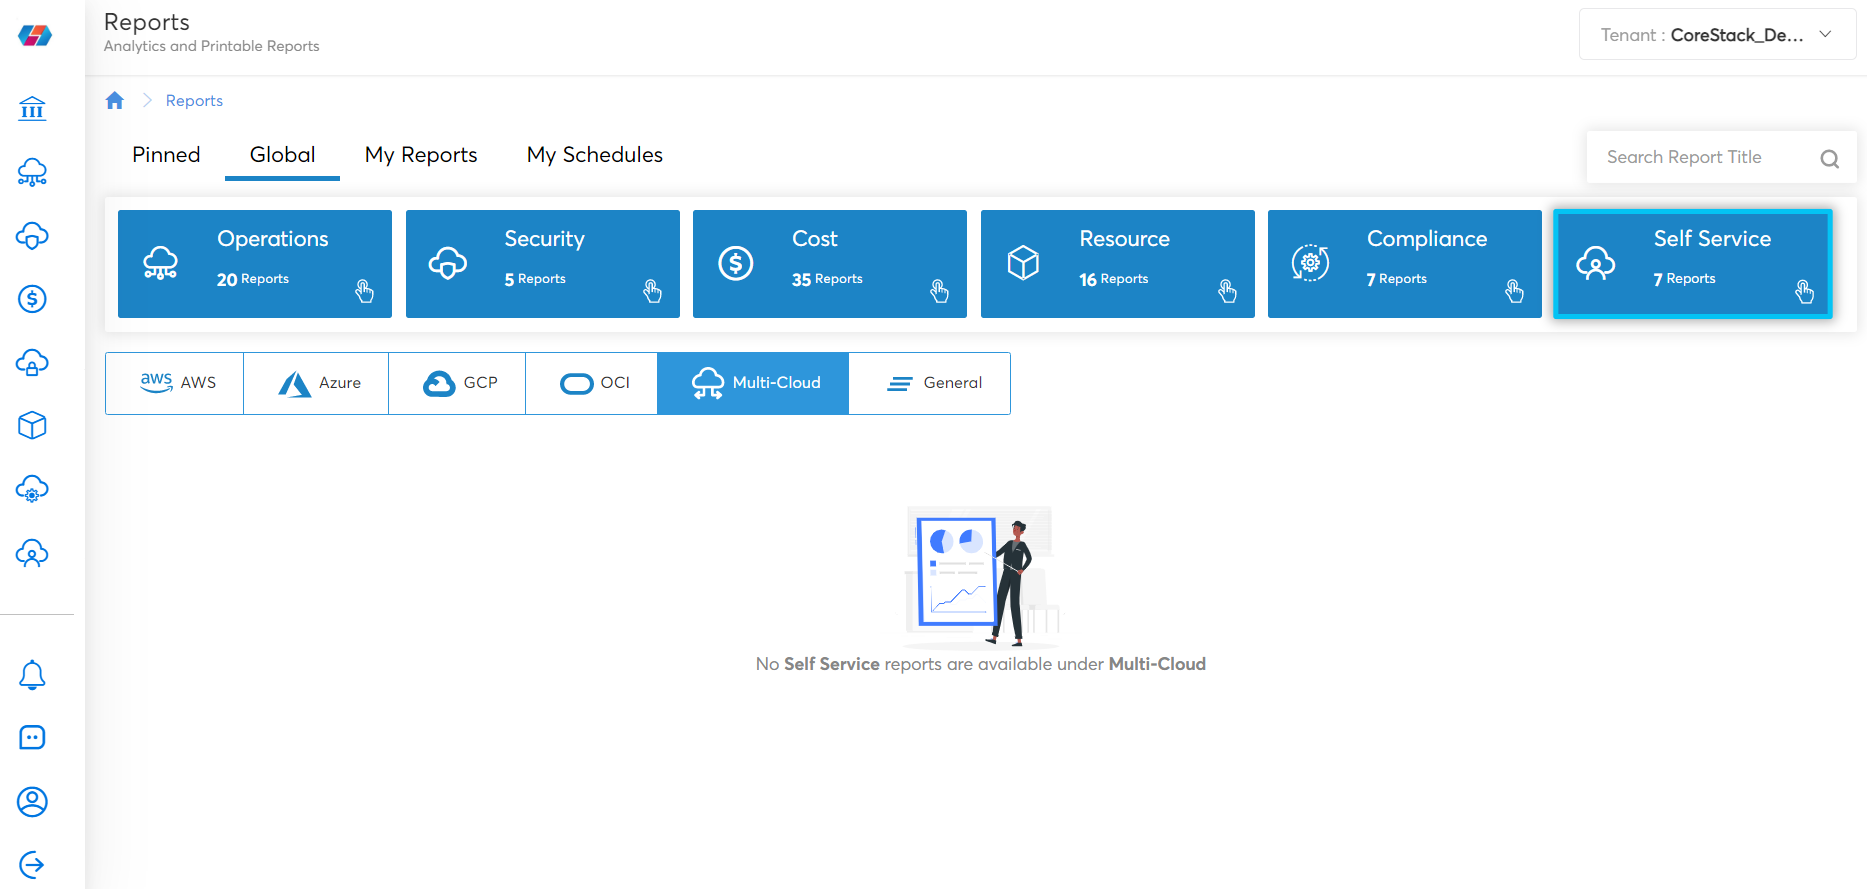
- Click Resource.
- Click Azure.
- Click Inventory Reports.
- Click Azure Newly Added Resource.
- Add Tenant, Cloud Account, Start Date and End Date.
- Click View Report.
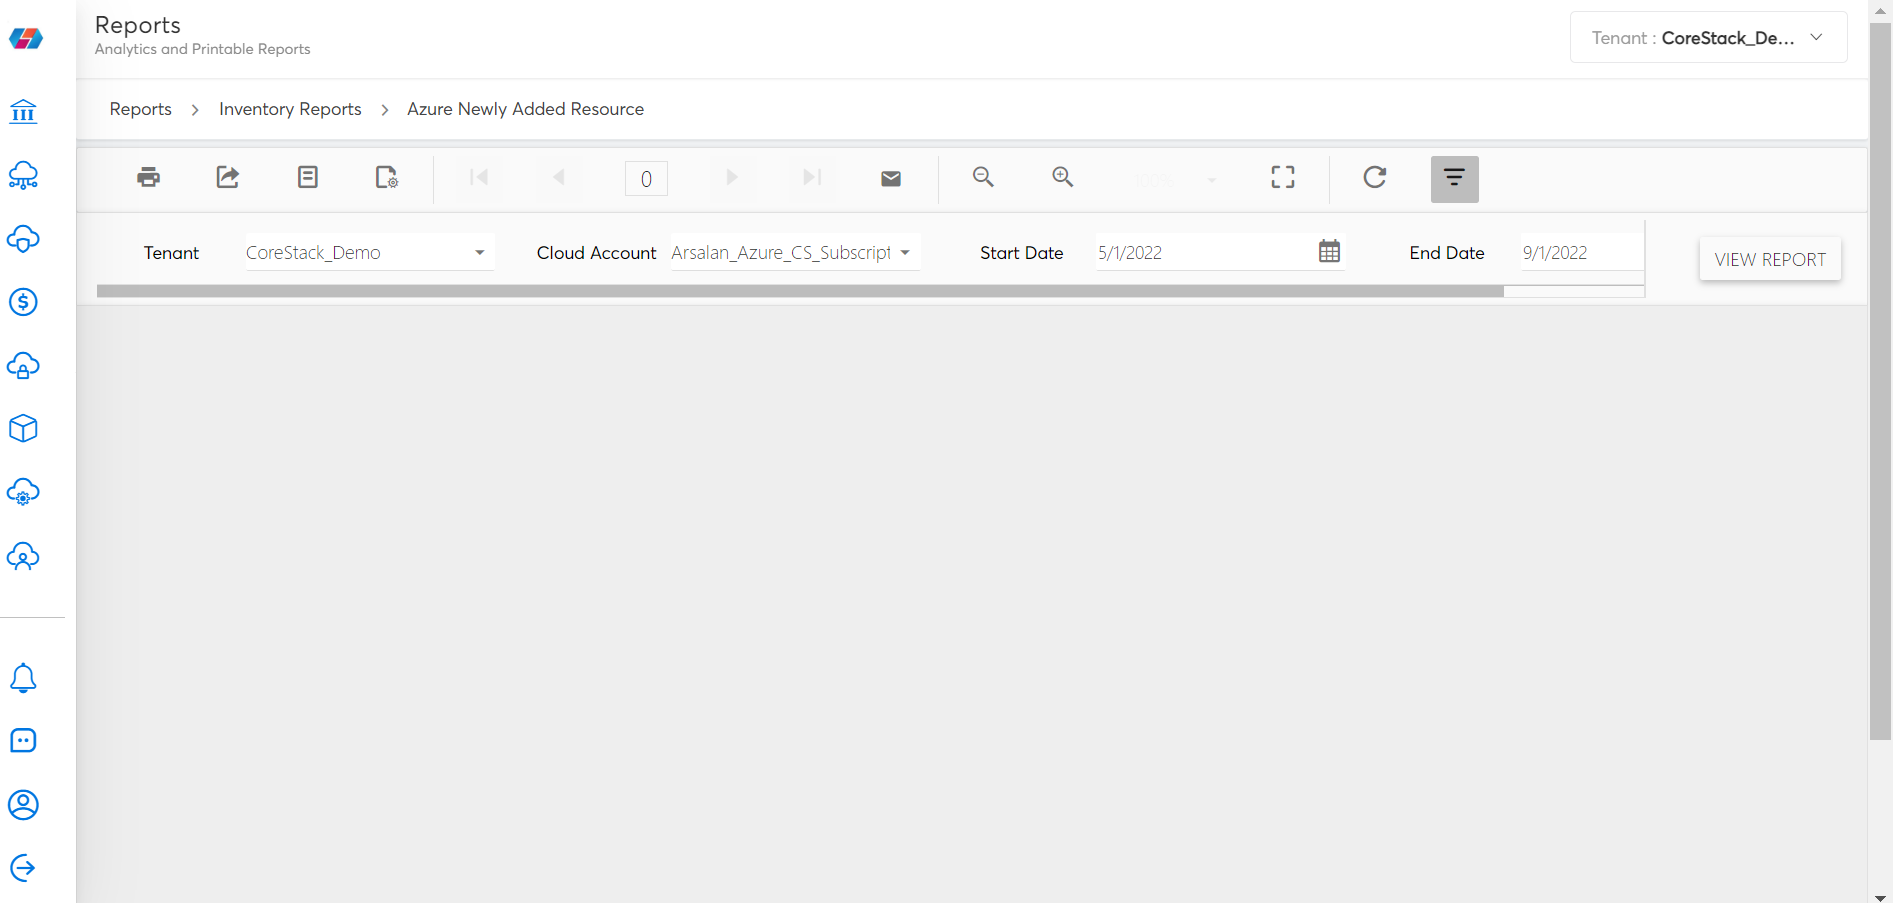
The Azure Newly Added Resource report appears.
Azure Tag Report
Tags are metadata elements that you apply to your Azure resources. They are key-value pairs that help you identify resources based on settings that are relevant to your organization. You can apply tags to your Azure resources, resource groups, and subscriptions.
- Click Reports.
- Click Resource.
- Click Azure.
- Click Inventory Reports.
- Click Azure Tag Report.
- Add Tenant, Cloud Account, Start Date and End Date.
- Click View Report.
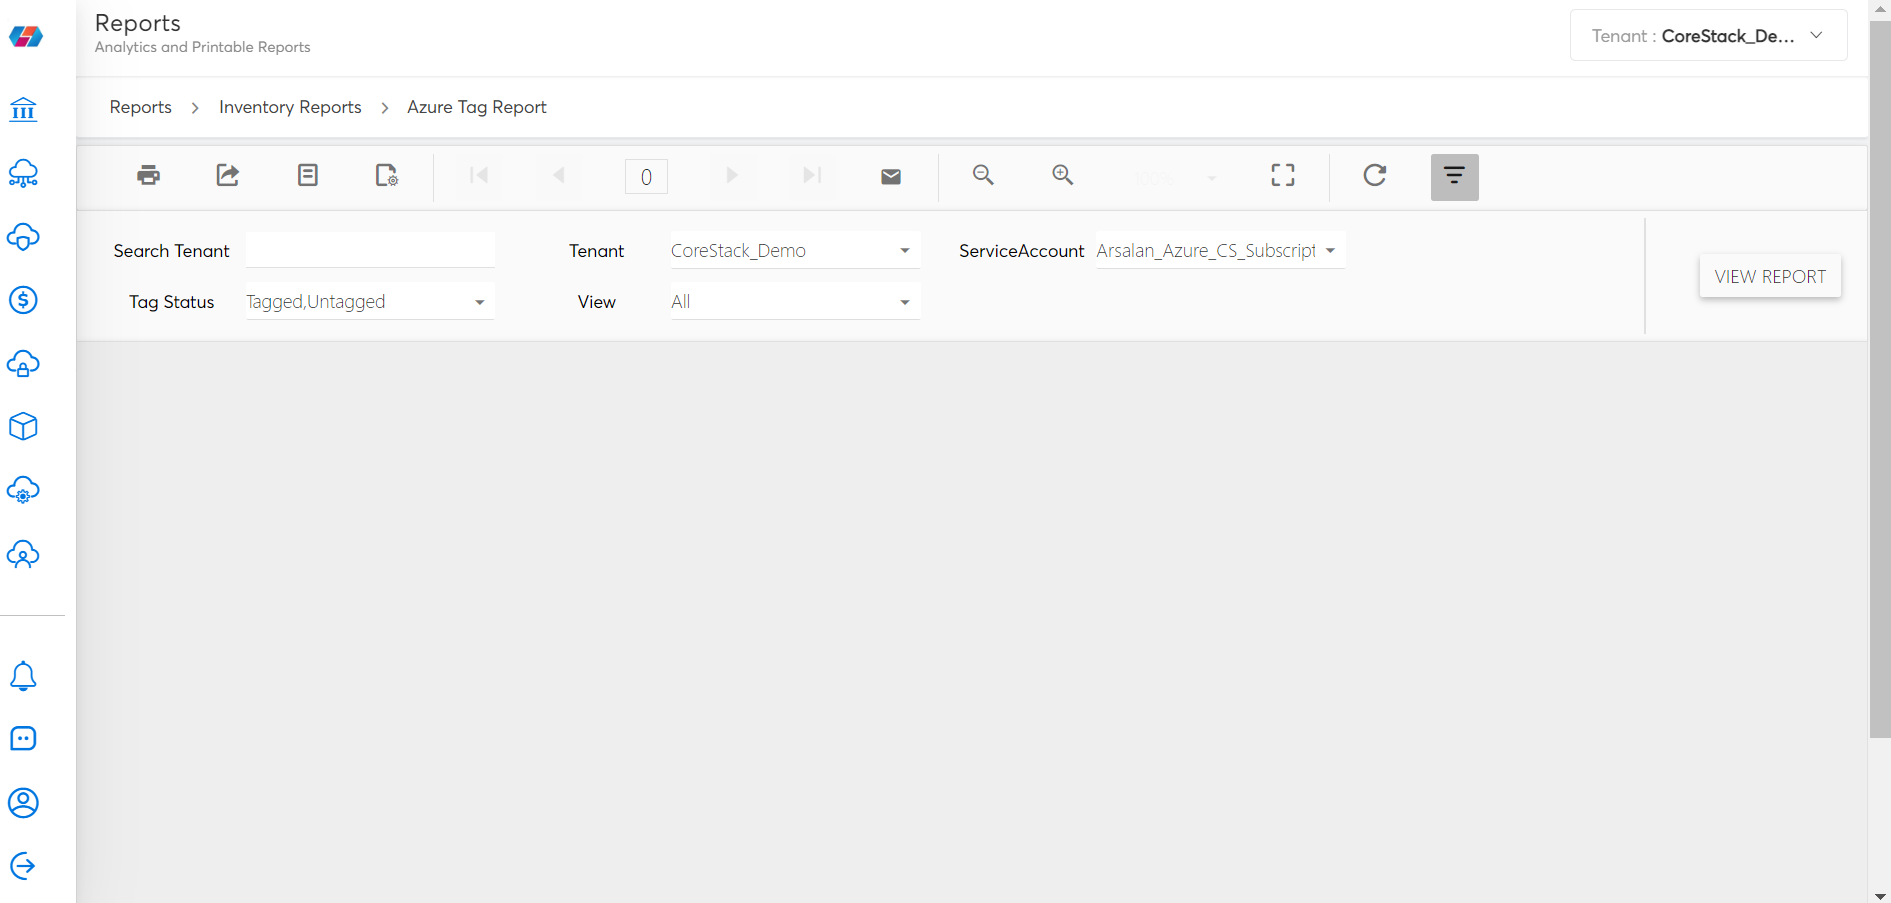
The Azure Tag Report appears.
All Resource Inventory Details Report
The All Resource Inventory Details Report is an SSRS report that can be generated and viewed by users. This report can be scheduled to be sent to users. This report provides information about various inventories and is a multi-cloud report. This report can be downloaded in PDF and Excel file formats.
Generating and Viewing All Resource Inventory Details Report
Perform the following steps to generate and view the All Resource Inventory Details Report:
-
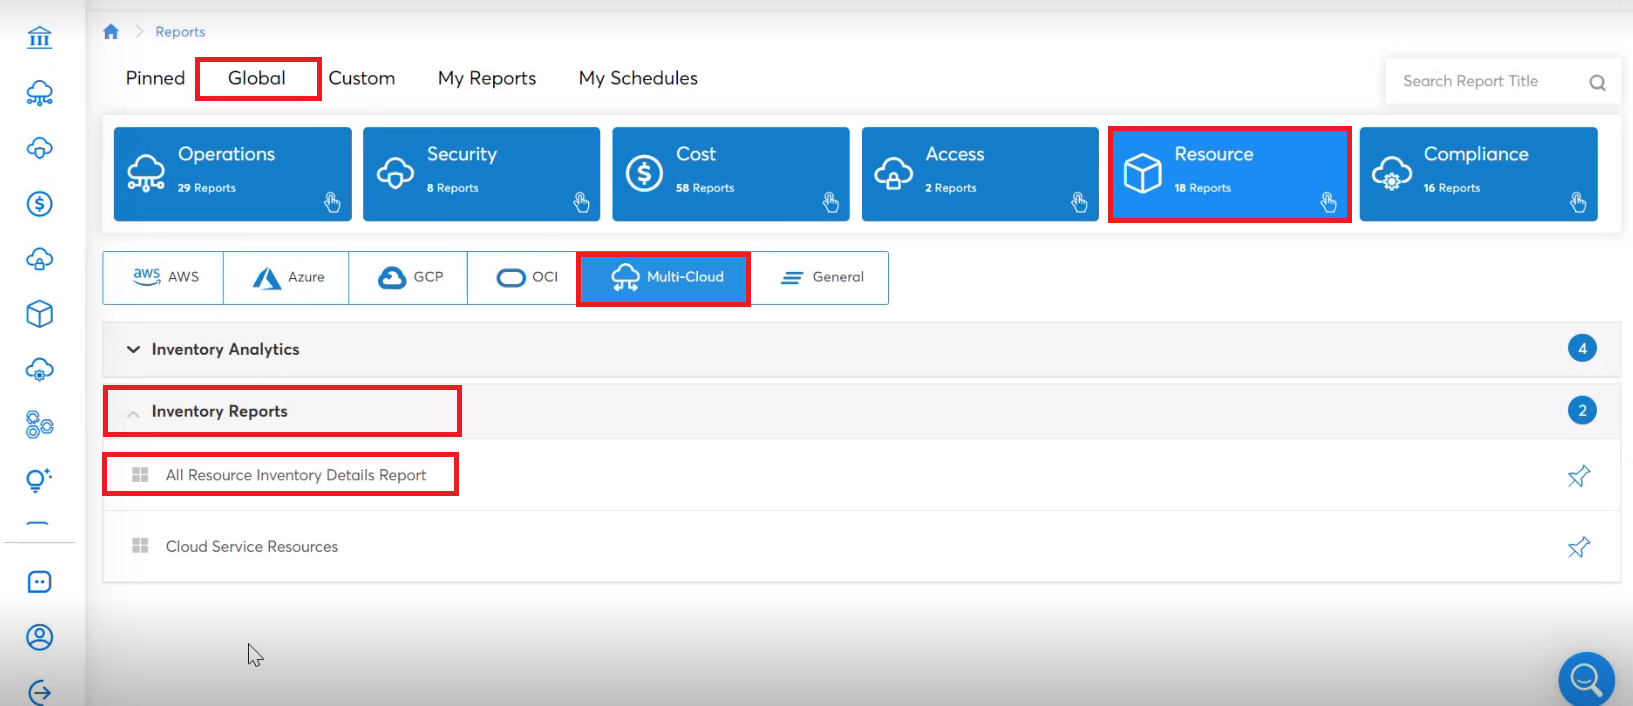
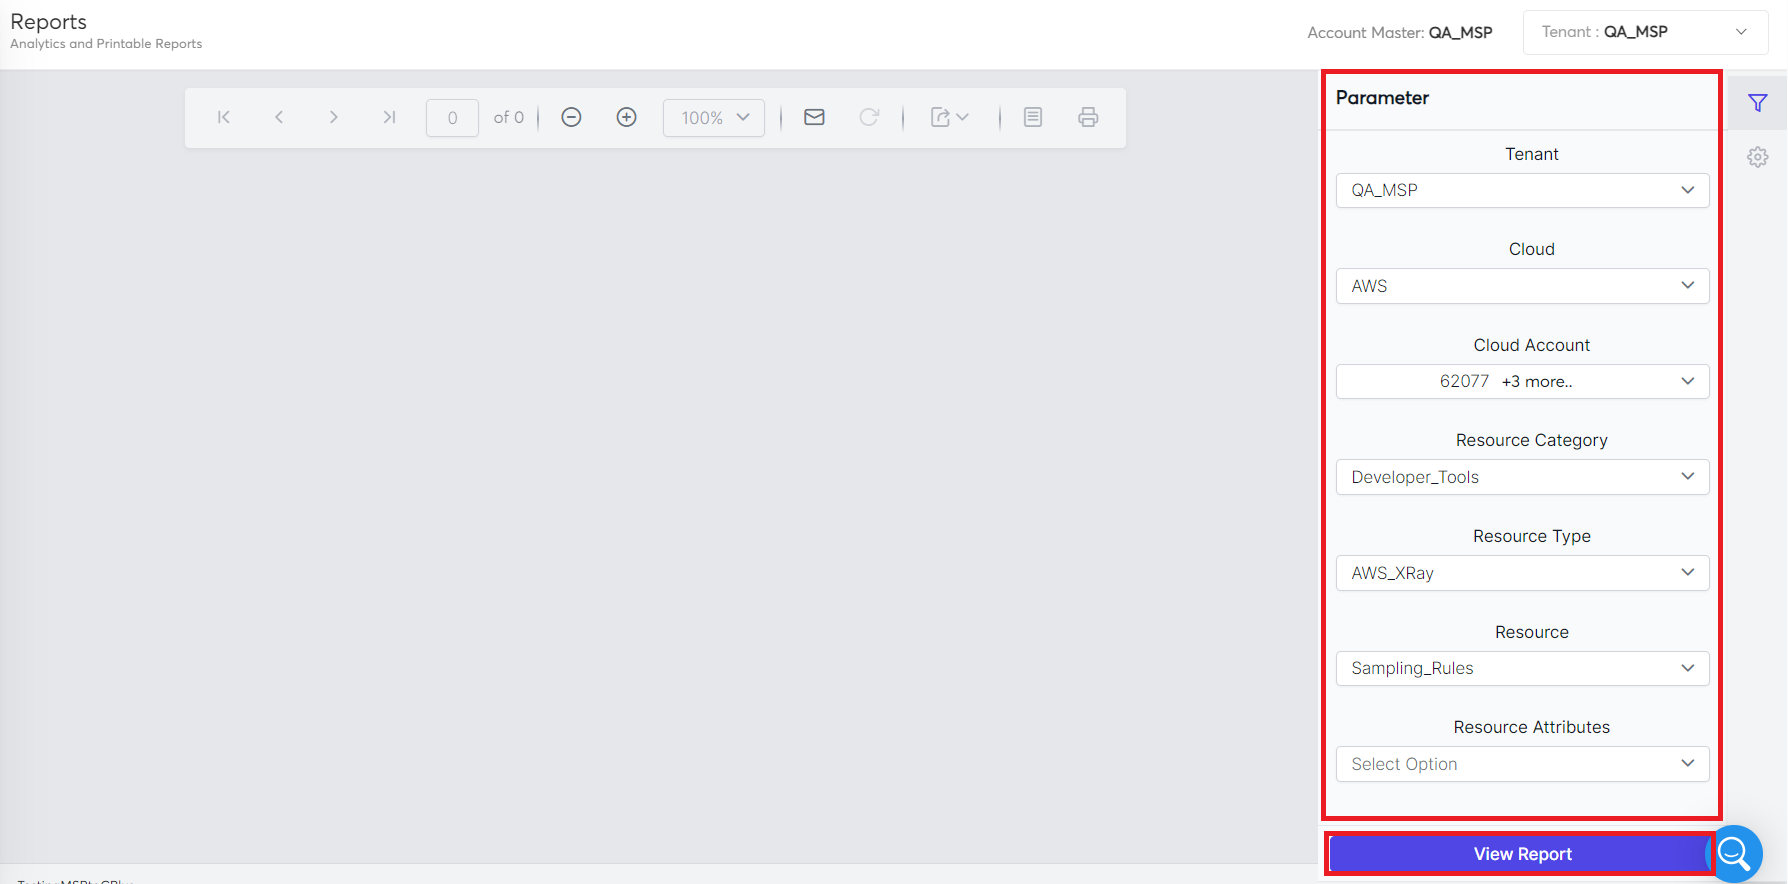
Access CoreStack and go to Reports > Resource > Multi-Cloud > Inventory Reports > All Resource Inventory Details Report.
-
In the Parameter pane on the right, select the required options and click View Report. It’s mandatory to fill all these fields.
-
In the Tenant list, click to select a tenant.
-
In the Cloud list, click to select a cloud provider.
-
In the Cloud Account list, click to select the relevant cloud accounts. You can select multiple options.
-
In the Resource Category list, click to select a relevant resource category.
-
In the Resource Type list, click to select the type of resource.
-
In the Resource list, click to select a resource.
-
In the Resource Attributes list, based on the options selected above, certain options are selected by default. You can go ahead with the selected options or just select the ones you need.
You can now view the report.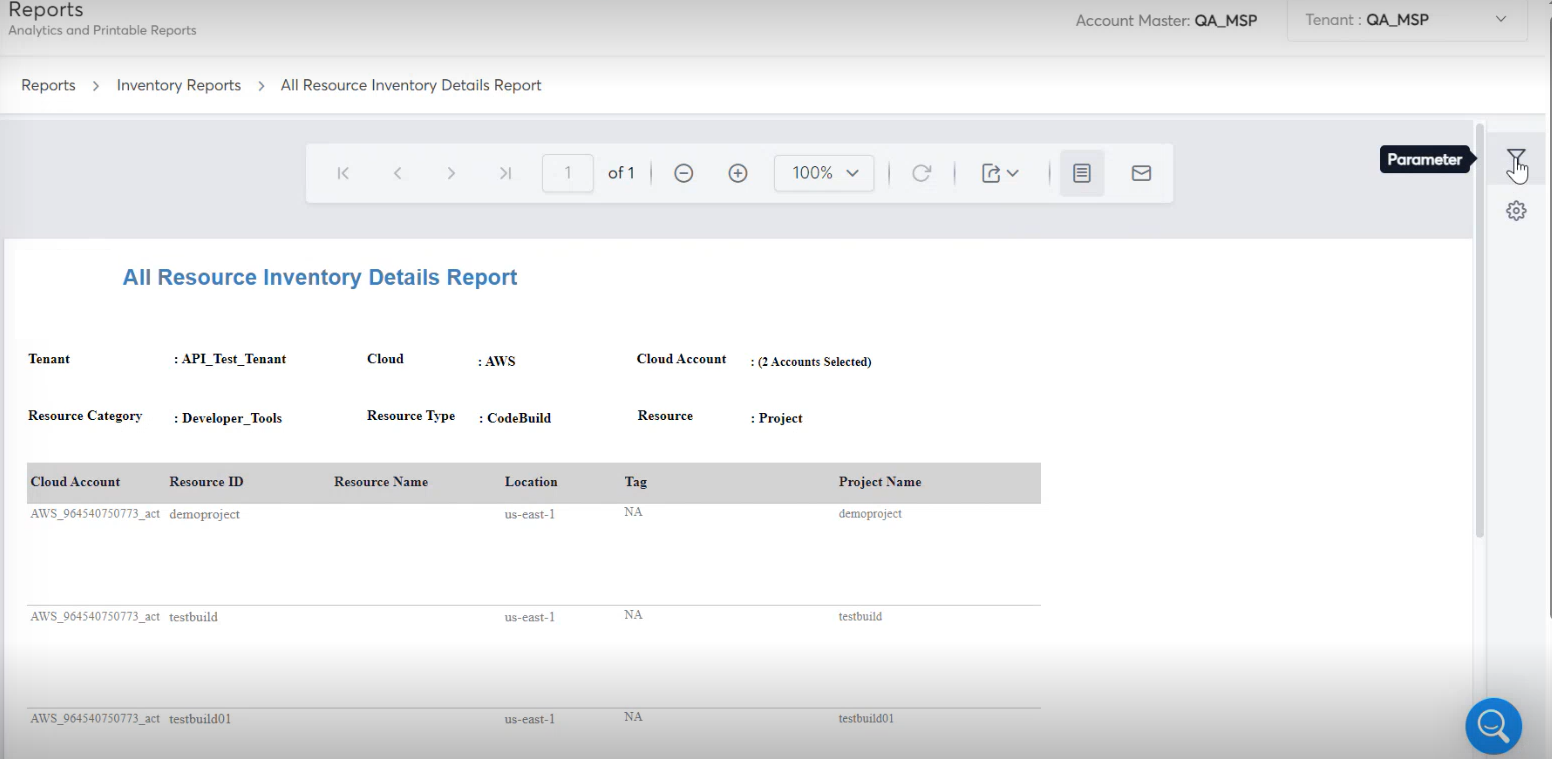
-
-
If you want to change the parameters of the report at any time, then on the extreme right of the screen, hover your mouse on Parameter and click on it. The Parameter pane shows, and you can update the fields as per your need and view the report again.
Note:
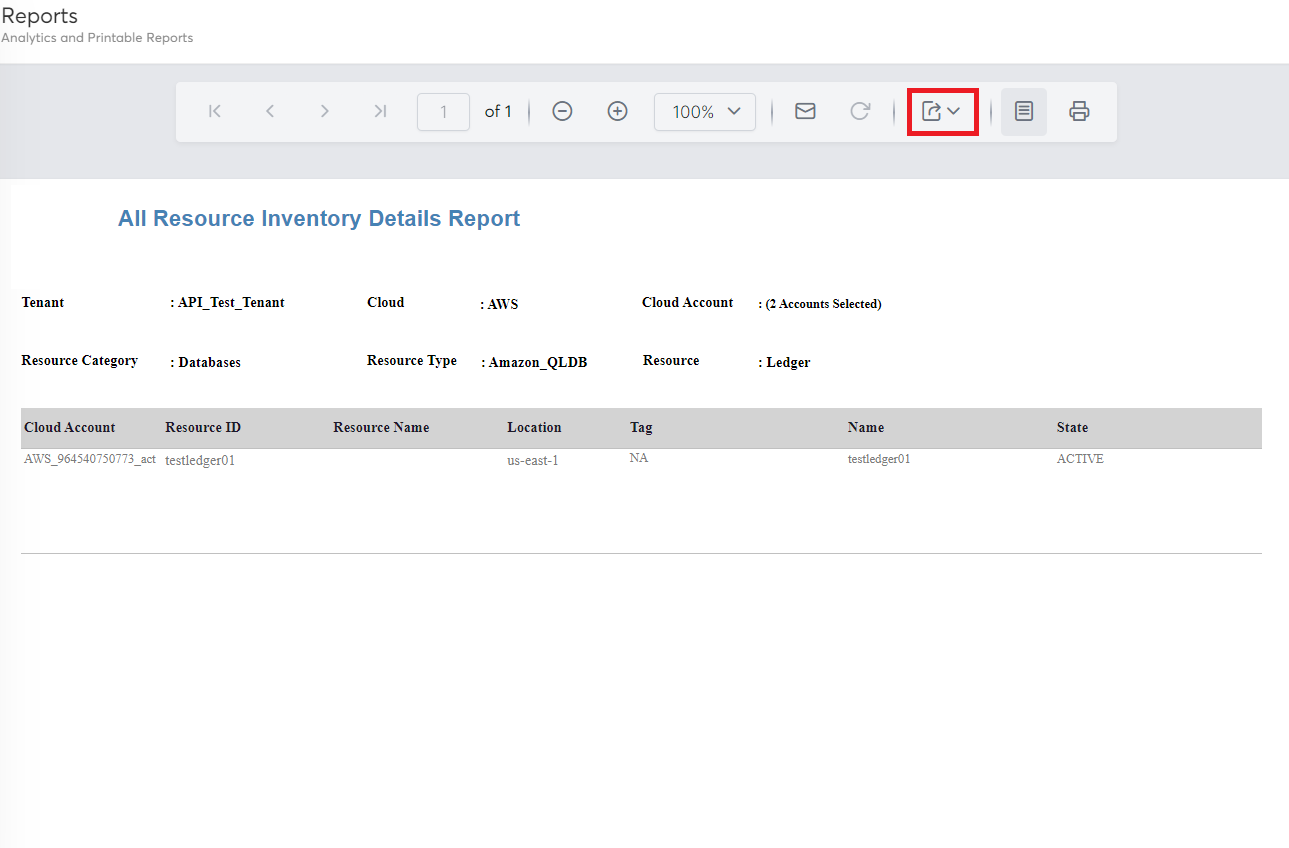
After expanding the Parameter pane, you will also see the options Export Setup and Page Setup.
- Expand Page Setup to see options for modifying the page size, width, height, margin, orientation, etc.
- Expand Export Setup to find options for downloading the report in Excel and PDF formats.
- To download the report, click Export and select either PDF or Excel. You can then view the report in the selected format.
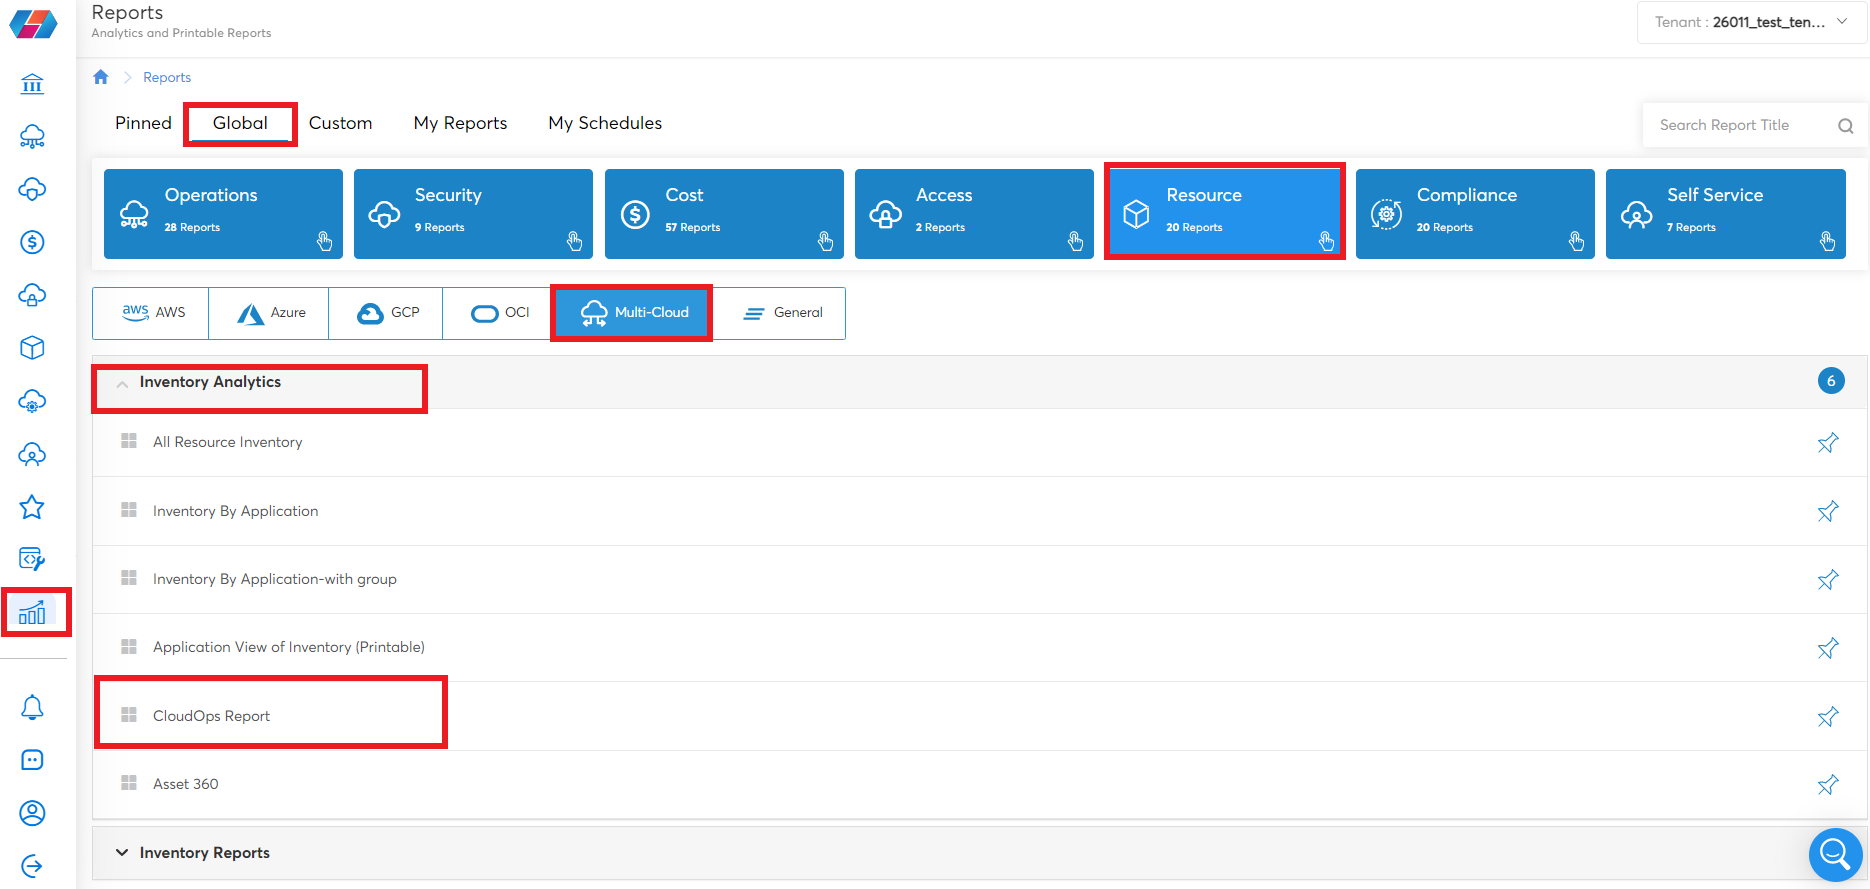
CloudOps Report
A CloudOps Report provides customers with insight into their cloud infrastructure's performance. This report helps in optimizing cloud operations, reducing costs, and identifying potential risks and vulnerabilities.
Users can access the CloudOps Report from the CoreStack application and can view details about inventory, utilization, and availability.
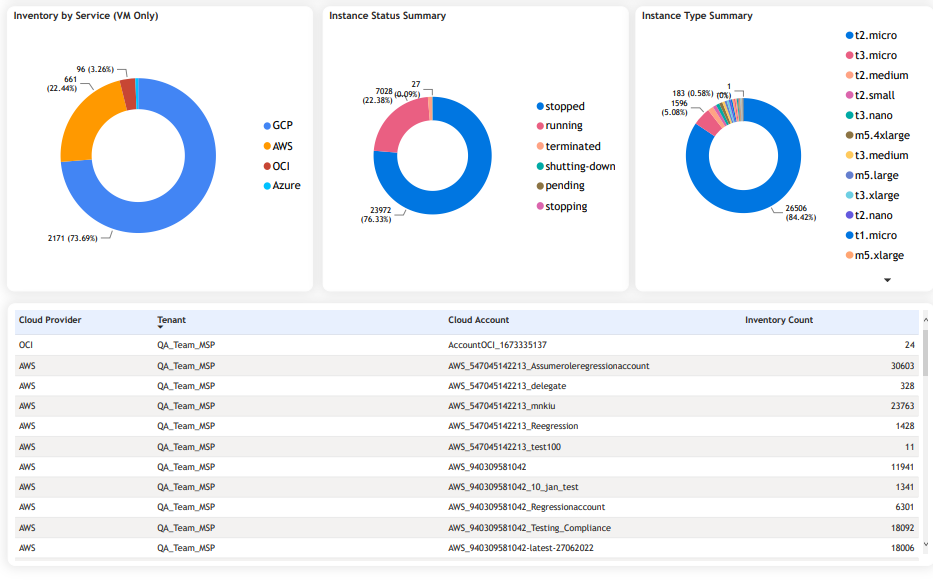
The Inventory report provides the count of the inventory, tagged resources, untagged resources, resource categories, resource types, etc. Users can view the details in both pie chart and graphical format. Users can also view percentages of inventory by service, instance status summary, instance type summary, and more.
Accessing the CloudOps Report
To view the CloudOps Report in the CoreStack application, navigate to Reports > Global > Resource > Multi Cloud > Inventory Analytics > CloudOps Report. The CloudOps Report is divided into three sections.
Users can view the following details in the CloudOps Report:
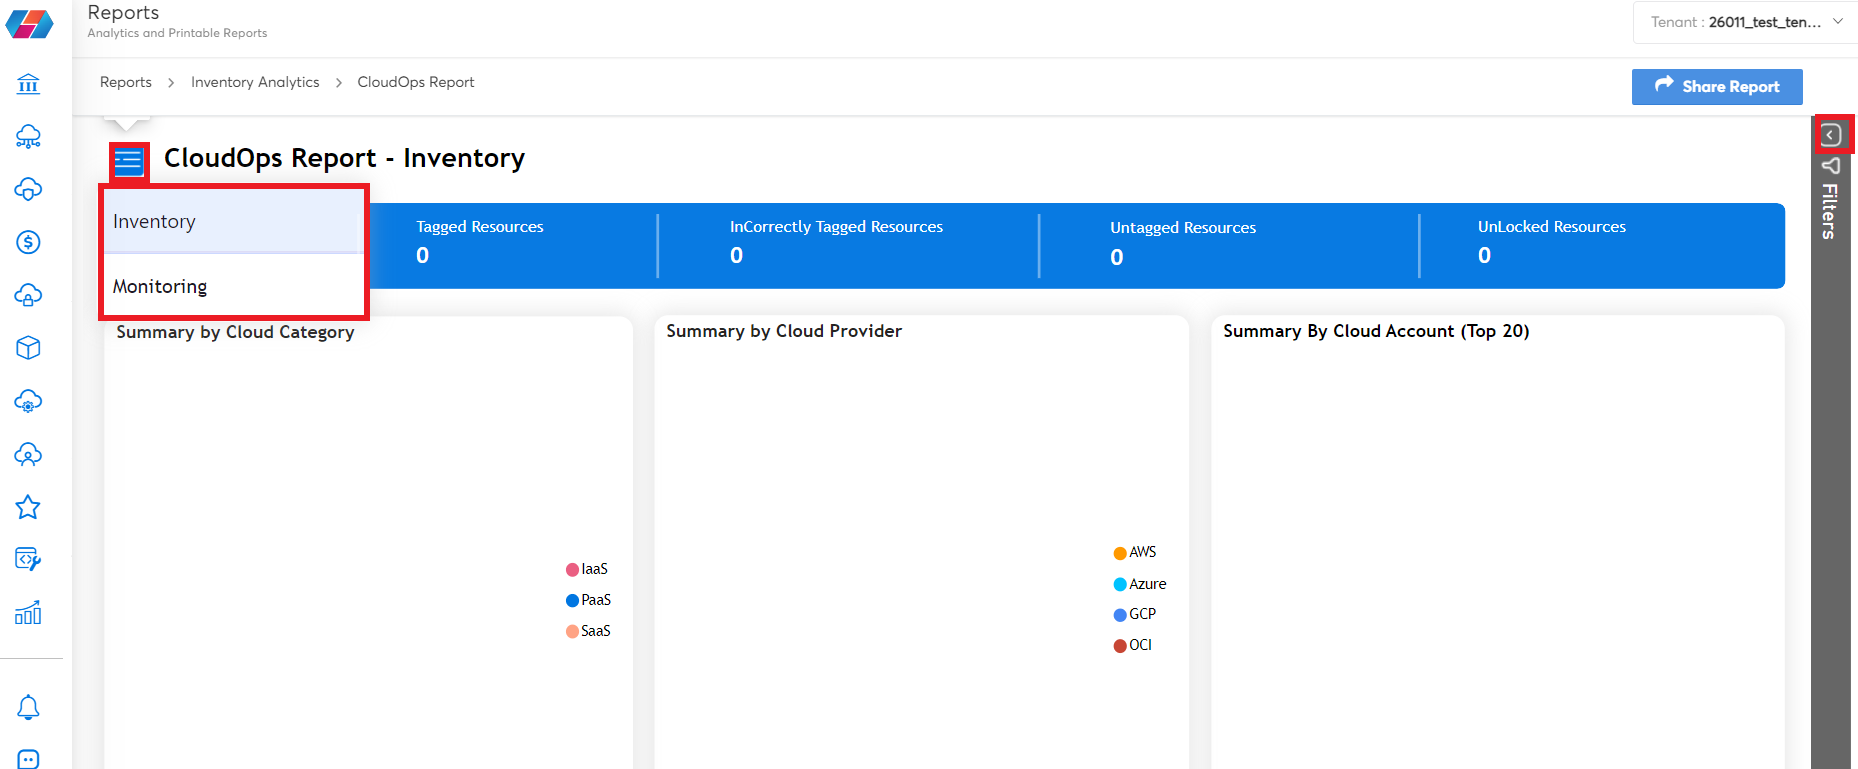
CloudOps Report Inventory: The Inventory report shows the following:
- Total Inventory: Shows the count of total inventory.
- Tagged Resources: Shows the count of tagged resources.
- Incorrectly Tagged Resources: Shows the count of incorrectly tagged resources.
- Untagged Resources: Shows the count of untagged resources.
- Unlocked Resources: Shows the count of unlocked resources.
- Summary by Cloud Category: Shows the count of different types of cloud categories, such as platform-as-a-service (PaaS), infrastructure-as-a-service (IaaS), and software-as-a-service (SaaS).
- Summary by Cloud Provider: Shows the count of cloud provider types like AWS, Azure, GCP, and OCI.
- Summary By Cloud Account (Top 20): Shows the top 20 cloud accounts.
- Added/Removed Resources For Last 30 Days: Shows the count of added or removed resources for the last 30 days.
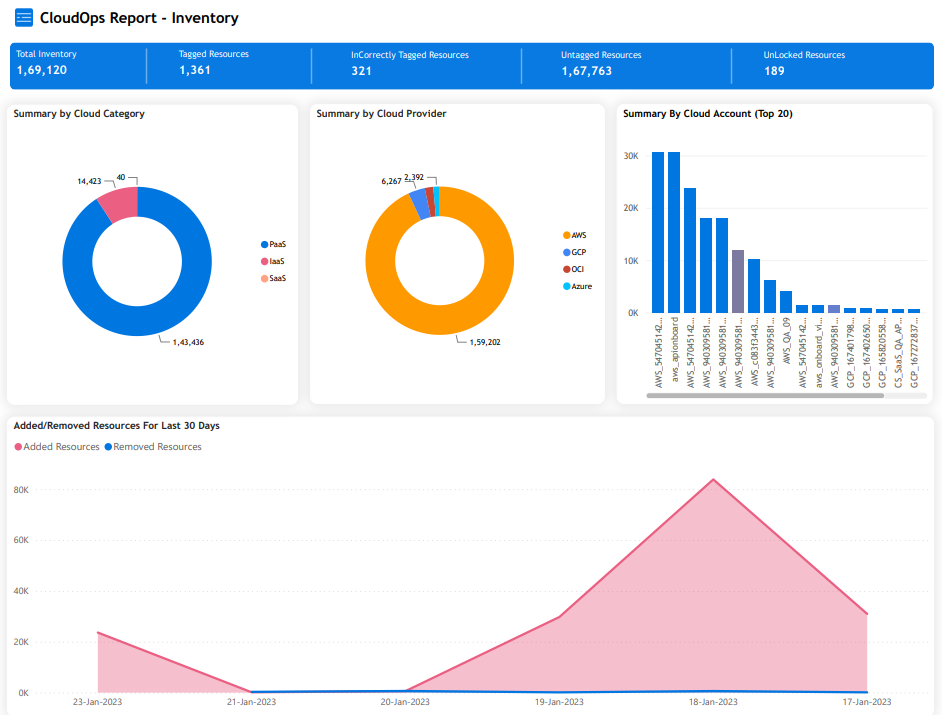
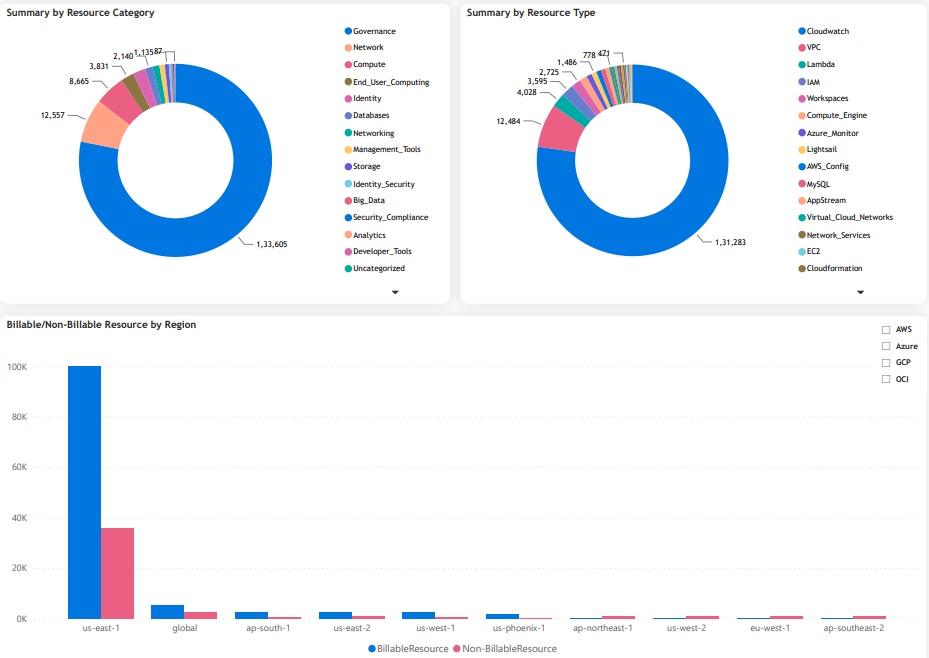
- Summary by Resource Category: Shows the count of resources per category.
- Summary by Resource Type: Shows the count of resources by type.
- Billable/Non-Billable Resource by Region: Shows the count of billable or non-billable resources by region.
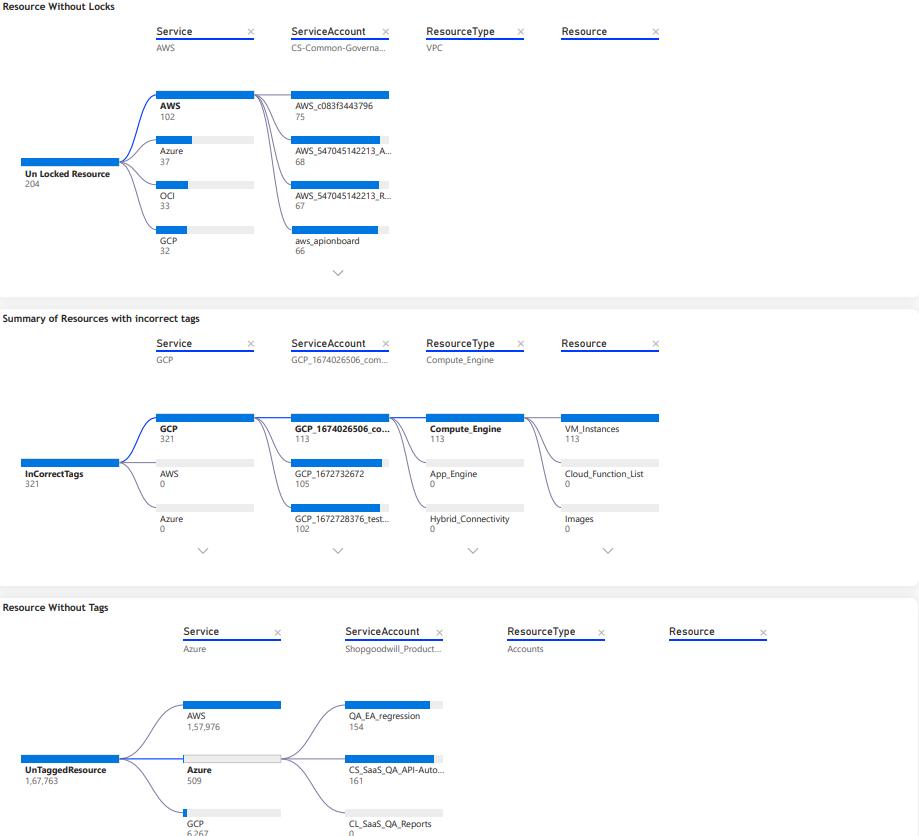
- Resource Without Locks: Shows the overall count of resources without locks, count of resources as per cloud provider type, resources as per service account, etc.
- Summary of Resources with incorrect tags: Shows the count of resources with incorrect tags.
- Resource Without Tags: Shows the count of resources without tags.
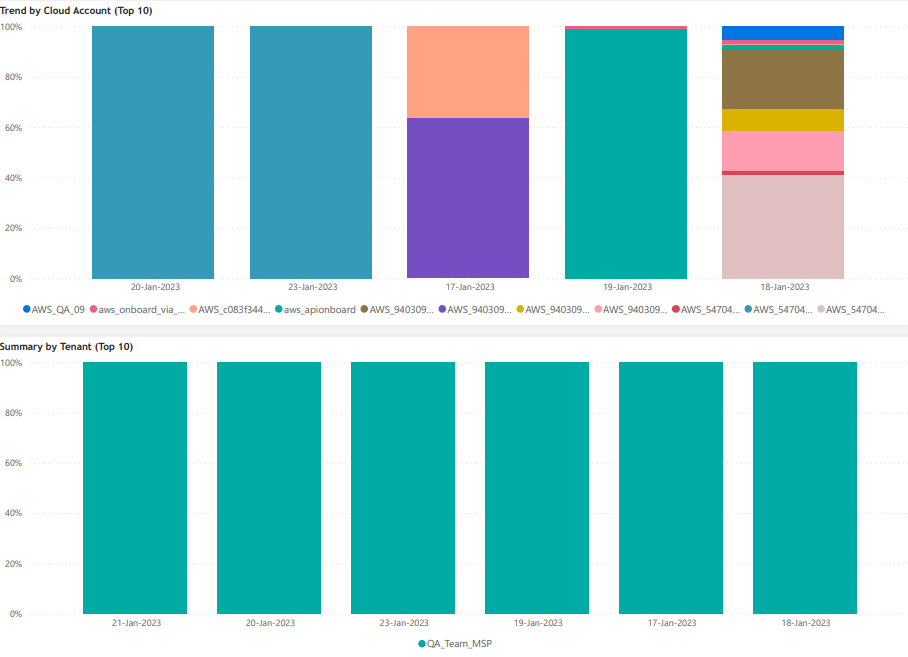
- Trend by Cloud Account (Top 10): Shows the trend of top 10 cloud accounts as per dates.
- Summary by Tenant (Top 10): Shows trend of top 10 tenants as per date.
- Inventory by Service (VM Only): Shows the inventory percentage as per service for different provider types.
- Instance Status Summary: Shows the instance status percentage.
- Instance Type Summary: Shows the instance type percentage.
CloudOps Report – Utilization
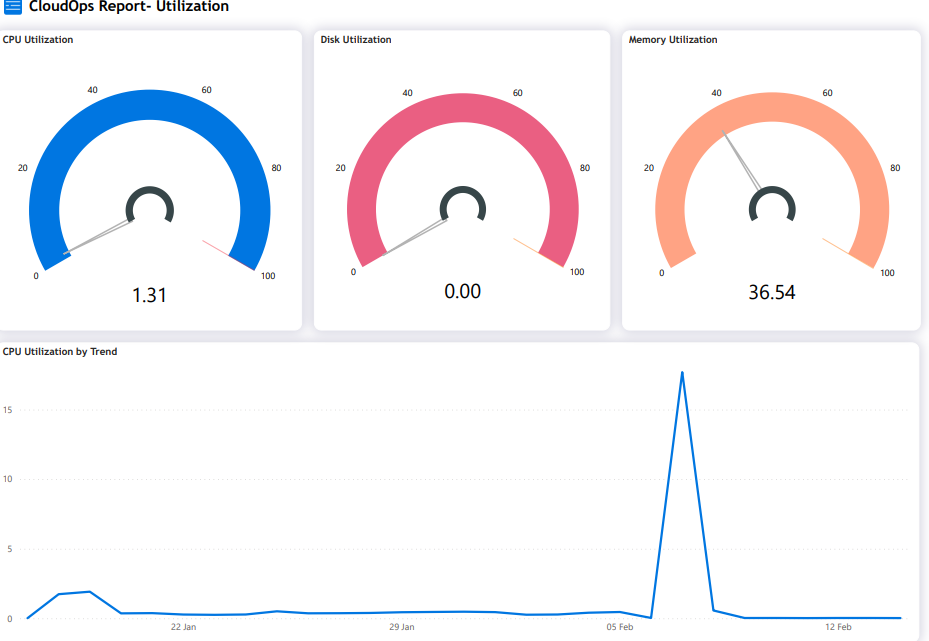
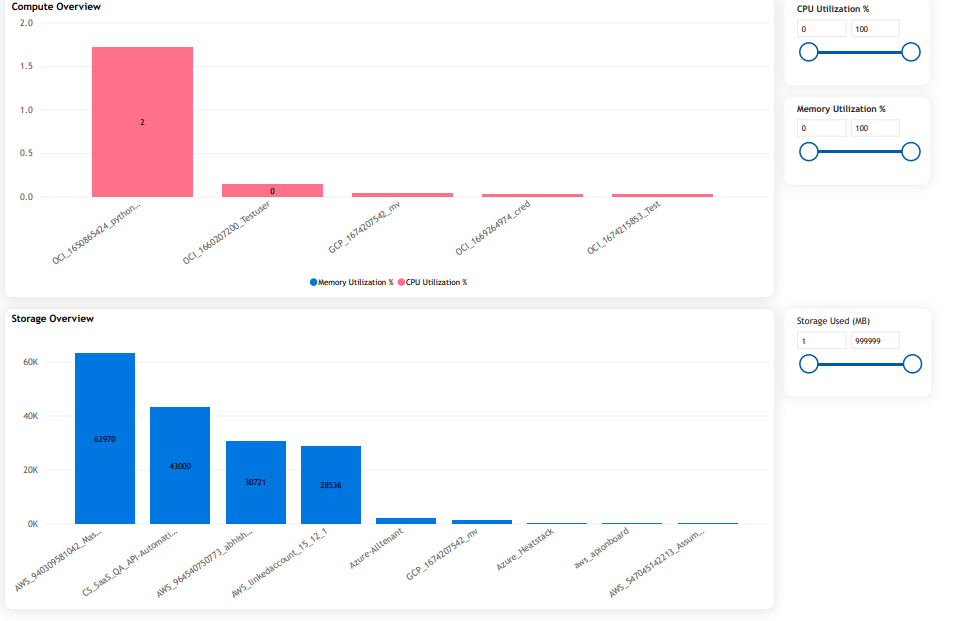
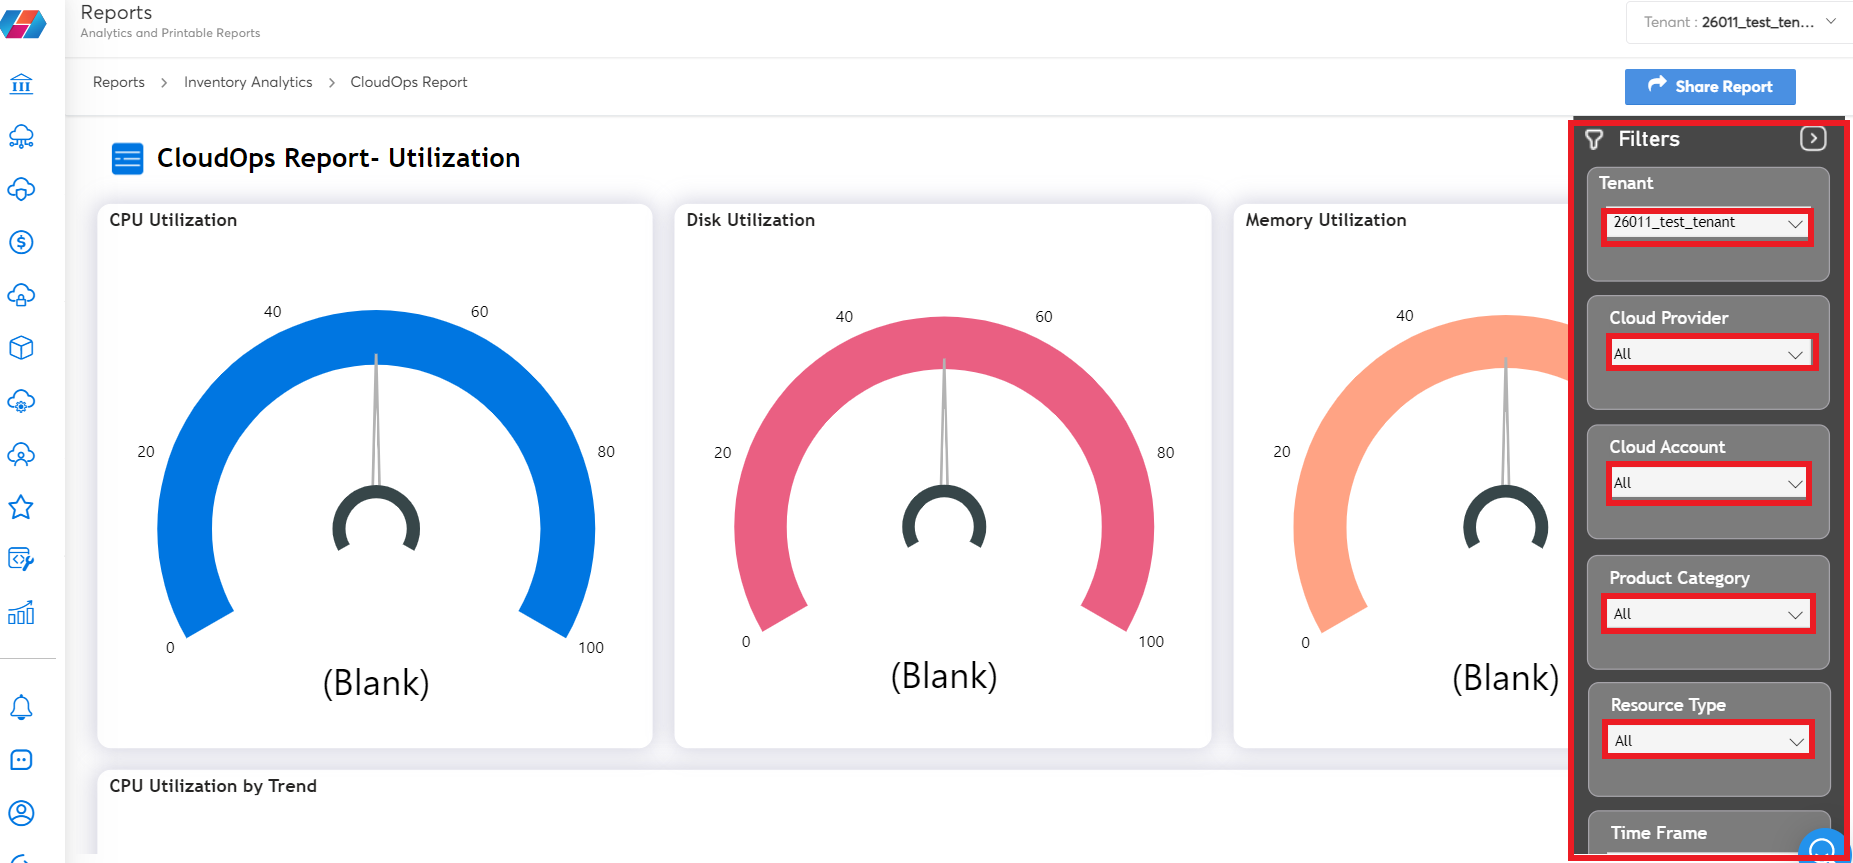
The Utilization report provides utilization details about CPU, disk, memory, etc. The details are shown in both pie chart and graphical format. Users can also view details about network packet in/out, disk read/write operations, network overview, storage overview, compute overview, and more.
- CPU Utilization: Shows CPU utilization details. CPU utilization refers to the percentage of time the central processing unit (CPU) is working on tasks. It is a measure of how much processing power is being used by a system at any given time.
- Disk Utilization: Shows disk utilization details. Disk utilization refers to the amount of time the disk drive is actively reading or writing data. Monitoring disk utilization can help identify performance issues and optimize system resources for improved efficiency.
- Memory Utilization: Shows memory utilization details. Memory utilization refers to the amount of physical memory (RAM) being used by a system. Monitoring memory utilization can help identify memory-intensive applications and optimize memory usage for improved performance.
- CPU Utilization by Trend: Shows a graph of CPU utilization for different dates.
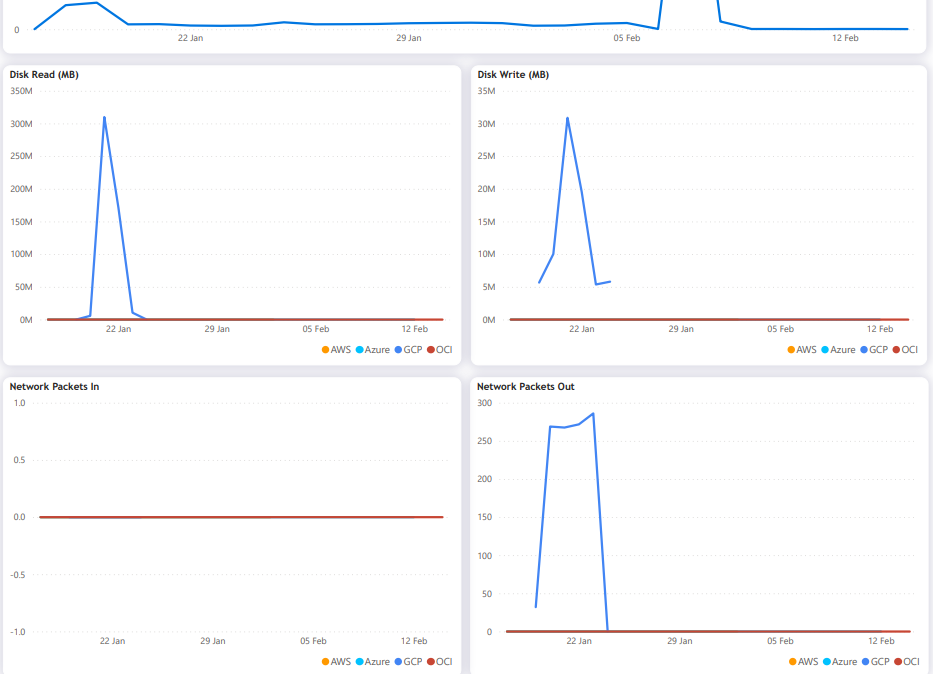
- Disk Read (MB): Shows the disk read trend in megabytes for different days.
- Disk Write (MB): Shows the disk write trend in megabytes for different days.
- Network Packets In: Shows the network packet-in trend for different days.
- Network Packets Out: Shows the network packet-out trend for different days.
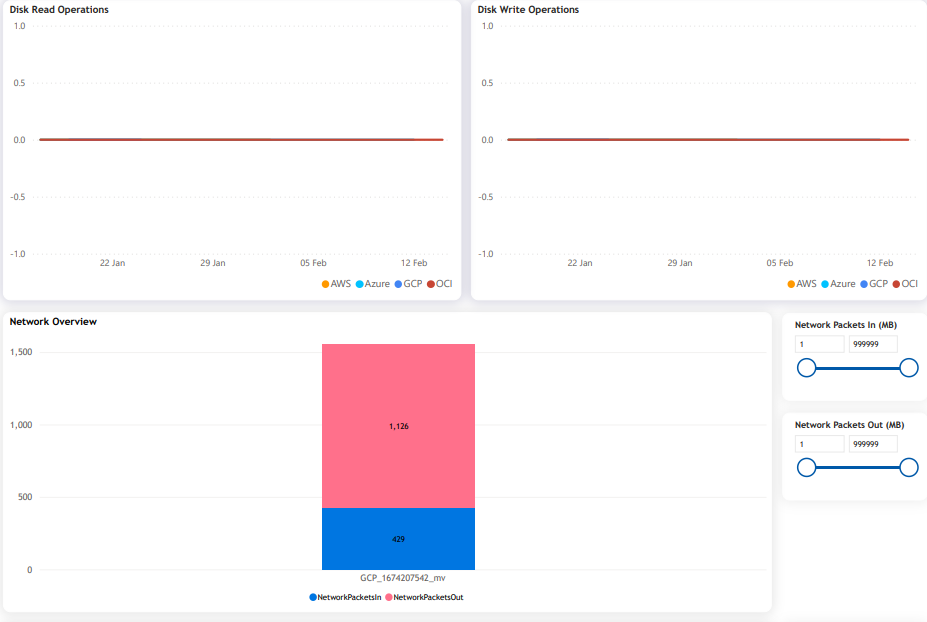
- Disk Read Operations: Shows disk read operation details for different days.
- Disk Write Operations: Shows disk write operation details for different days.
- Network Overview: Shows network overview for cloud accounts.
- Compute Overview: Shows an overview of compute resource utilization for different cloud accounts.
- Storage Overview: Shows an overview of storage resource utilization for different cloud accounts.
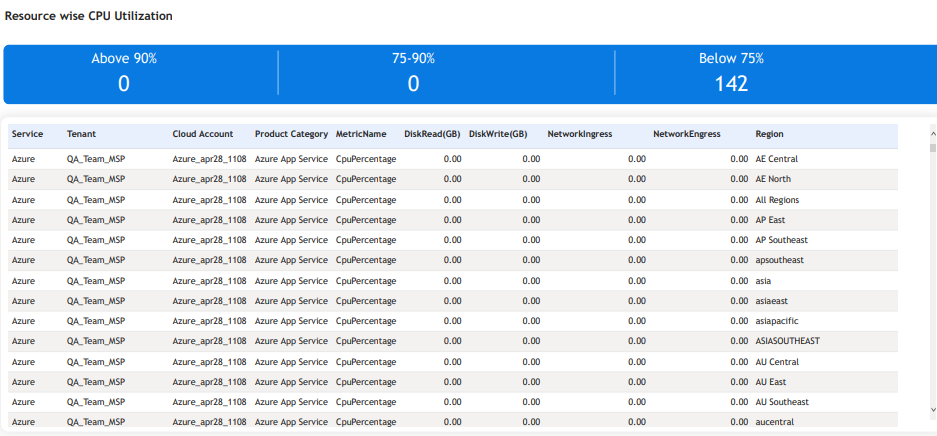
- Resource wise CPU Utilization: Shows resource-wise CPU utilization details and a table that provides different utilization metrics like DiskRead, DiskWrite, etc.
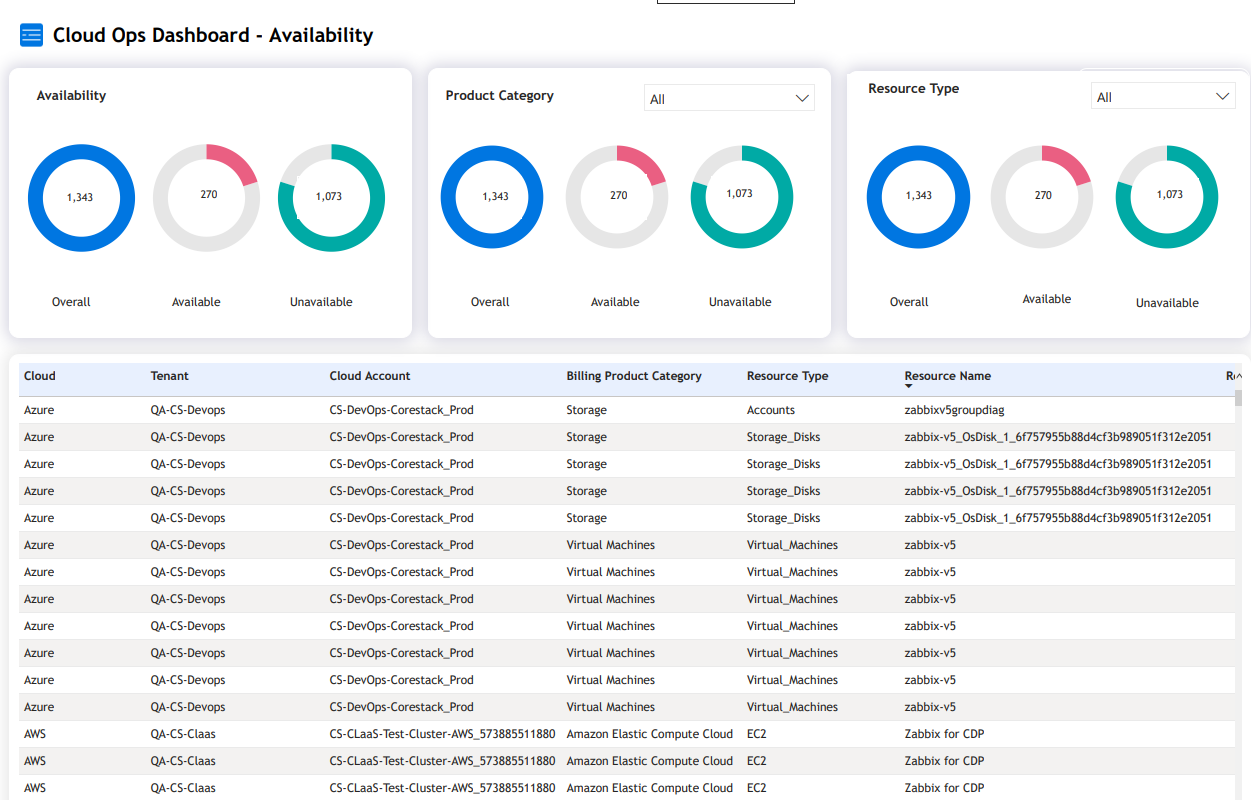
CloudOps Dashboard – Availability:
The Availability dashboard shows the count of available and unavailable product categories and resource types. A user can also view availability details in a tabular format. The table shows details about cloud provider type, cloud account name, tenant name, billing product category, resource type, resource name, etc.
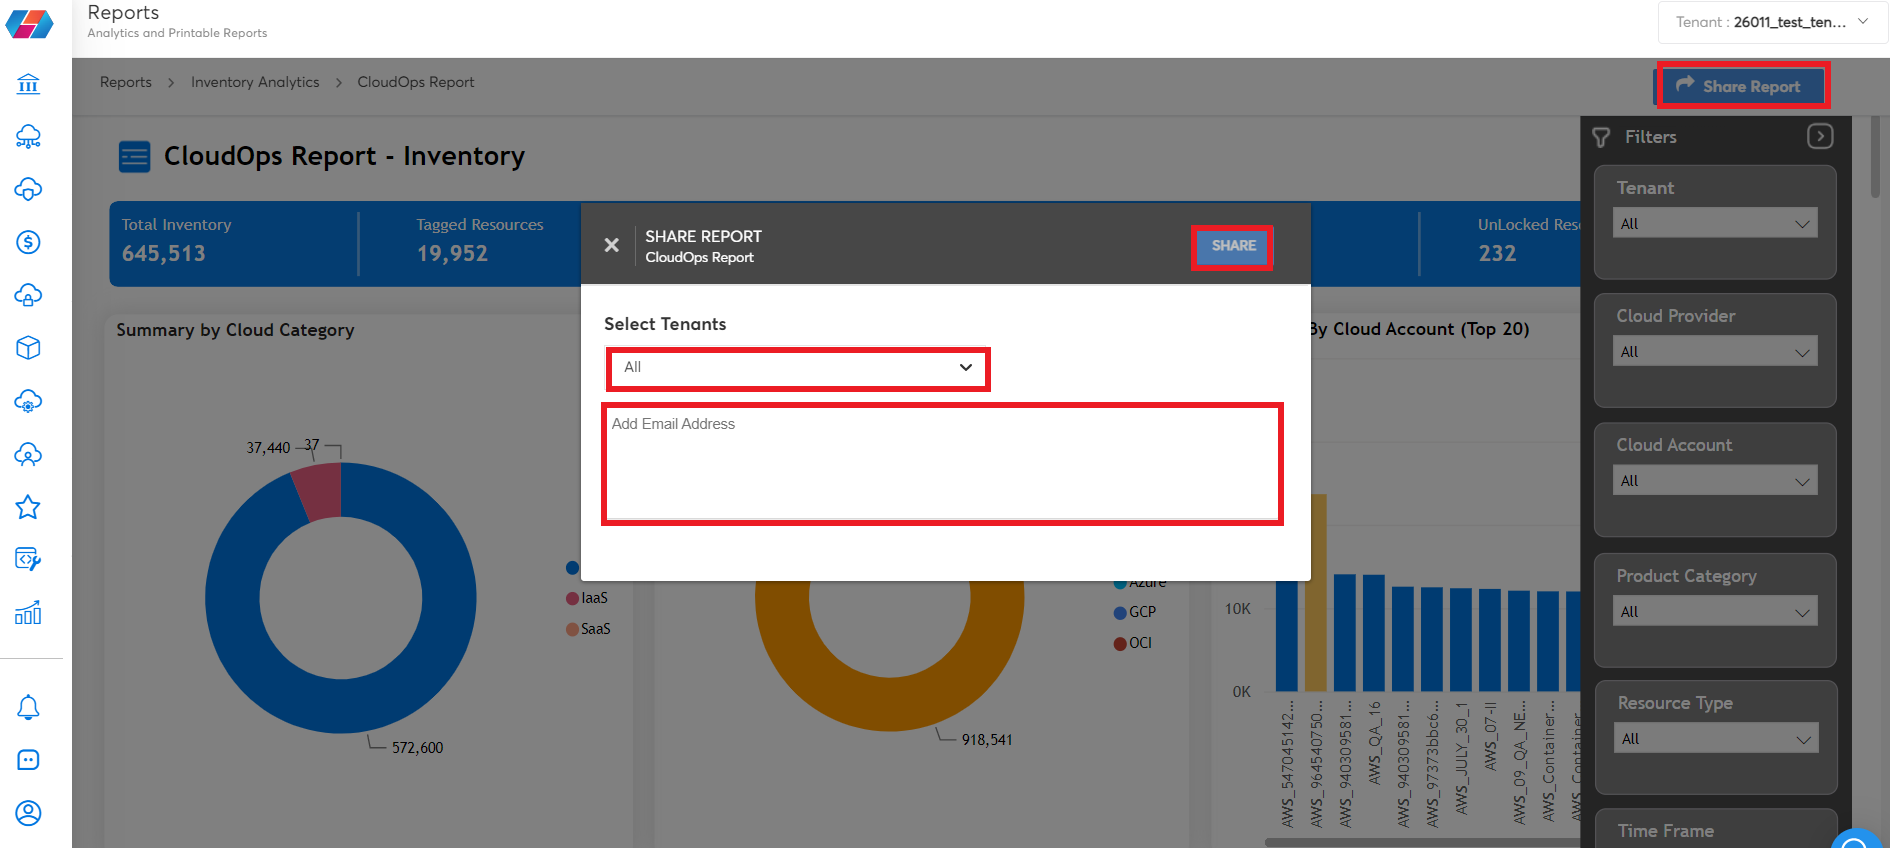
To share the report, perform the following steps:
- Click Share Report.
- In the SHARE REPORT dialog box, in the Select Tenants list, select the tenants with whom the report needs to be shared, and click Apply.
- In the Add Email Address text box, type the email address of the recipient.
- Click SHARE.
To view specific information in the CloudOps Report, the user can apply appropriate filters and view the report.
Perform the following steps to apply a filter to a report:
-
Click the blue tile on the left of the screen and select the relevant option as per which filters will be displayed in the filter pane on the right side of the screen.
-
On the filter pane located on the right side of the screen, click the arrow icon.
- In the various fields that are displayed on the filter pane, click to select the relevant option(s):
- Tenant
- Cloud Provider
- Cloud Account
- Product Category
- Resource Type
- Time Frame
The report is displayed as per the selected options in the filter pane.
Note:
Click Clear Filter to reset the filter selections.
Updated 5 months ago